As of July 2026, Singapore dominates with a score of 100/100 -- combining €67,500 average annual salary with a visa ease of 9/10. Iceland (67.6) and Australia (50) follow. The index divides annual salary by visa difficulty (11 minus ease score) to find countries where earning potential best offsets immigration barriers.
Compiled from official government sources · re-checked H2 2026 · methodology & sources · full data provenance
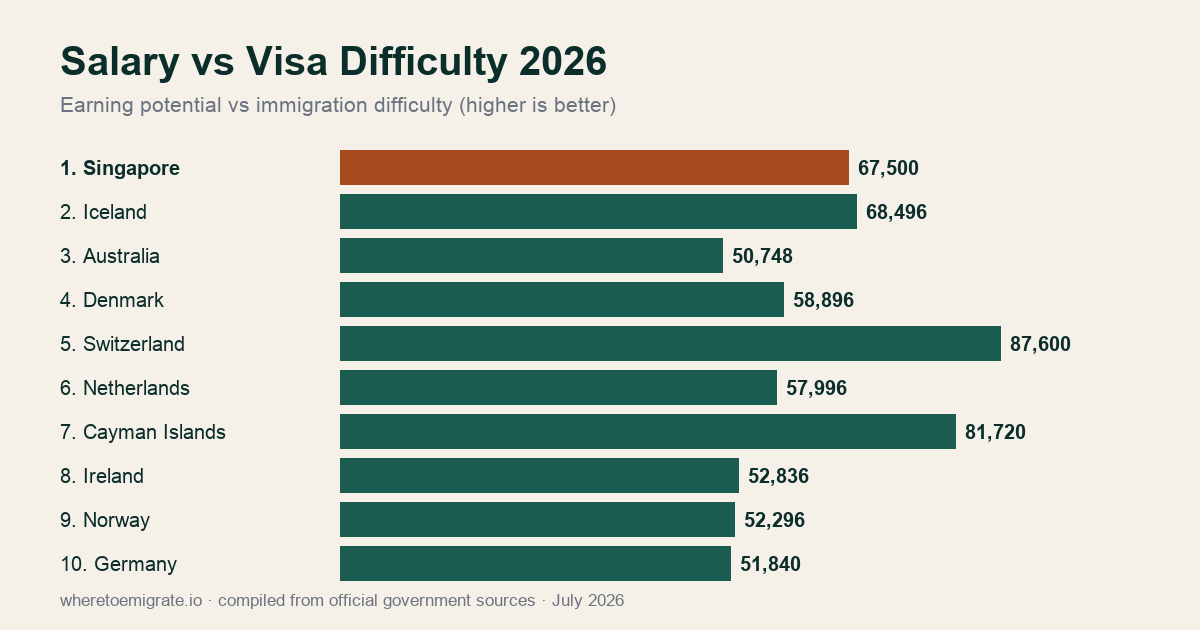
Top 20 Countries -- Salary vs Visa Difficulty
The ratio divides annual salary (EUR) by visa difficulty (11 − ease score). Higher ratio = better pay relative to how hard it is to get in. Scores normalised to 0–100. Tiers: Excellent ≥ 80, Good 60–79.9, Fair 40–59.9, Challenging < 40.
| # | Country | Avg Salary | Ease | Score / 100 | Tier |
|---|---|---|---|---|---|
| 1 | €67,500 | 9/10 | 100 |
Excellent | |
| 2 | €68,496 | 8/10 | 67.6 |
Good | |
| 3 | €50,748 | 8/10 | 50 |
Fair | |
| 4 | €58,896 | 7/10 | 43.5 |
Fair | |
| 5 | €87,600 | 5/10 | 43.1 |
Fair | |
| 6 | €57,996 | 7/10 | 42.8 |
Fair | |
| 7 | €81,720 | 5/10 | 40.2 |
Fair | |
| 8 | €52,836 | 7/10 | 39 |
Challenging | |
| 9 | €52,296 | 7/10 | 38.6 |
Challenging | |
| 10 | €51,840 | 7/10 | 38.3 |
Challenging | |
| 11 | €38,472 | 8/10 | 37.8 |
Challenging | |
| 12 | €37,524 | 8/10 | 36.9 |
Challenging | |
| 13 | €24,372 | 9/10 | 36 |
Challenging | |
| 14 | €48,504 | 7/10 | 35.8 |
Challenging | |
| 15 | €72,504 | 5/10 | 35.7 |
Challenging | |
| 16 | €47,796 | 7/10 | 35.3 |
Challenging | |
| 17 | €81,108 | 4/10 | 34.2 |
Challenging | |
| 18 | €68,496 | 5/10 | 33.7 |
Challenging | |
| 19 | €42,120 | 7/10 | 31 |
Challenging | |
| 20 | €38,496 | 7/10 | 28.3 |
Challenging |
Showing top 20 of 190+ countries ranked.
Download full 191-country dataset (CSV)Methodology
The Salary vs Visa Difficulty Index measures the trade-off between earning potential and immigration barriers in each country.
Annual Salary
Average annual salary in EUR, sourced from country_meta economics data. Uses avg_salary or median_salary_net_monthly when average is unavailable.
Visa Ease
Score from 0 to 10 measuring how accessible a country's visa system is for skilled workers. Derived from programme database analysis.
Ratio Formula
ratio = annual_salary / (11 - ease). Higher ease lowers the denominator, boosting the ratio. Normalised to 0-100 scale across all countries.
The formula rewards countries that combine strong salaries with accessible visa systems. A country like Singapore scores highly because it offers competitive pay (€67,500/yr) and a relatively open visa system (9/10 ease). Countries with very high salaries but restrictive visas (e.g. Bermuda, US) rank lower because the difficulty denominator increases.
Limitations: Average salary does not reflect sector-specific earnings. Visa ease is a country-level score that does not account for nationality-specific restrictions. The index does not factor in cost of living -- a high salary in an expensive city may not translate to better net income.
Read full methodology →How to Use This Data
Use this index to shortlist countries where your earning potential is highest relative to immigration barriers. But remember: your actual salary depends on your profession, experience, and the specific visa you qualify for.
A software engineer in Singapore will earn far more than the country average, while a hospitality worker may earn less. The visa difficulty also varies by your nationality and qualifications. Take the free assessment to get salary and visa data specific to your profile.
Get Your Personalized Verdict
14 questions. 2 minutes. We match your passport, profession, savings, and priorities against 2,500+ visa programmes and return a Eligible / Almost verdict for every viable country.
Get Your Personalized Verdict → FreeNo signup required · Instant results
Primary Data Sources
- whereTOemigrate -- Internal Programme Database 2026. +2,500+ visa and residency pathways across 190+ countries. Visa ease scores derived from programme analysis. wheretoemigrate.io
- cost-of-living tools -- Cost of Living Index 2026. Average salary data, updated quarterly.
- OECD -- Taxing Wages 2025. Net salary benchmarks for OECD member states. stats.oecd.org
- World Bank -- World Development Indicators 2025. GDP per capita and labour market data. data.worldbank.org
Visa rules change every month.
Get the changes that matter for your move — one email a month, unsubscribe anytime.